Recently, i've been reading up books on investment and i would like to particularly highlight a topic which i came across from book: The Winning Investment Habits of Warren Buffett & George Soros. I will not highlight content of the book, though, as some of the topics takes more than my knowledge to apprehend. In future, i hope to share the points that i picked up from it to all.
However, there is one particular topic inside the book which i truely agree with and hope to share.
Topic: Defining Your Circle of Competence
- Master Investor is uninterested in investment he don't understand because he knows his own limitations.
- This makes MI always define his circle of competence.
- MI makes money easily when he stay within that circle of competence.
- He is not inerested investing in something that is outside that circle although grass may be greener somewhere outside his circle.
To MI, his investment style is a fit to his personality. Doing something else is equivalent to wearing a suit that doesn't fit. An Armani suit that's too big or too small is worse that a cheap suit that's exact you size.
To Buffett and Soros, they built their circle of competence by answering 3 questions:-
1. What am i interested in?
2. What do i know now?
3. What do i like to know about, and be willing to learn?
Another important point that the author (Mark Tier), highlights is to consider whether if it's possible to make money in an area that interest you? One example of industry which he highlighted is the airline industry, which always fascinated him. However, he mention that airline industry is an investment blackhole requiring enless amount of capital which usually ends up going to pilots' union.
Conclusion:-
By answering the questions above, only then will you be able to zoom into your own investment niche and be very clear about your own limitations. This will also help you stay away from so called "investment opportunities" that fail to meet your criteria.
In other words, for a beginner investor like myself, it is important to find my own investment niche, in the field that i truly have interest in. From there, i will have to gather as much information as possible (A - Z ) about that industry, so that when i start investing in that particular investment niche, i know what is going on within that circle of competence. I know when is the right time to start buying and most importantly, when to sell it and make profit from it. In my opinion, this is one method that beginner or even advance investor should adopt to reduce risk of investment.
"if you dont understand it, don't do it," - Warren Buffett
Monday, January 12, 2009

Candlestick chart: Spinning Tops
Spinning Tops

Another type of candlestick chart, known as spinning top possess both long upper and long lower shadow. Spinning tops characteristics:-
- The short body shows small movement from open to close.
- Long shadows on the upper and lower side indicates buyer and seller were active during the trading session.
- The open and close maybe short (small), however, price move significantly higher and lower during the trading session.
- The short body shows small movement from open to close.
- Long shadows on the upper and lower side indicates buyer and seller were active during the trading session.
- The open and close maybe short (small), however, price move significantly higher and lower during the trading session.
Spinning tops indicates indecision trading. Neither party managed to dominate buying or selling actions, thus resulting in Standoff.
Indication:-
After Long Hollow (White) candlestick, a spinning top signify weakness among uptrend and a potential reverse or interruption in trend.
Conversely, after Long (Filled) candlestick, a spinning top signify weakness among downtrend and a potential reverse or interruption in trend.
Indication:-
After Long Hollow (White) candlestick, a spinning top signify weakness among uptrend and a potential reverse or interruption in trend.
Conversely, after Long (Filled) candlestick, a spinning top signify weakness among downtrend and a potential reverse or interruption in trend.
Thursday, January 8, 2009

Candlestick chart: Short and Long Shadow
Short vs Long Bodies
The shadow both on the upper and lower side of bodies indicates important information on the trading the session. Upper shadow shows session high while lower shadow indicates session low. Short shadow candlestick indicates that trading action is limited near to Open and Close. Long shadow candlestick means that trading action advance well past open and close.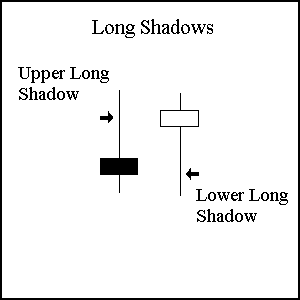 Long Upper Shadow and Short Lower Shadow :-
Buyer controlled the trading session, and bid prices higher. Later on, sellers forced the price down and this is followed by a weak close, thus forming long upper shadow.
Long Lower shadow and Short Upper shadow:-
Seller controlled the trading session, and push the price lower. Later on, buyer force the price up and this is followed by strong close, thus forming long lower shadow.
The shadow both on the upper and lower side of bodies indicates important information on the trading the session. Upper shadow shows session high while lower shadow indicates session low. Short shadow candlestick indicates that trading action is limited near to Open and Close. Long shadow candlestick means that trading action advance well past open and close.
Long Upper Shadow and Short Lower Shadow :-Buyer controlled the trading session, and bid prices higher. Later on, sellers forced the price down and this is followed by a weak close, thus forming long upper shadow.
Long Lower shadow and Short Upper shadow:-
Seller controlled the trading session, and push the price lower. Later on, buyer force the price up and this is followed by strong close, thus forming long lower shadow.
Wednesday, January 7, 2009
Candlestick chart: Marubozu

Diagram above indicates both black and white bodies without upper and lower shadow. This is known as Marubozu, and its characteristics:-
- The high and low are represented by open and close, in this case.
- White Marubozu, is represented by Open equals to Low and Close equals to High. This means that buyer control the price action from the start of trading to the last trade.
- Black Marubozu, is represented by Open equals to High and Close equals to Low. This means the seller control the price action from start of trading to the last trade.
- The high and low are represented by open and close, in this case.
- White Marubozu, is represented by Open equals to Low and Close equals to High. This means that buyer control the price action from the start of trading to the last trade.
- Black Marubozu, is represented by Open equals to High and Close equals to Low. This means the seller control the price action from start of trading to the last trade.
Tuesday, January 6, 2009
Candlestick chart: Short and Long Bodies
Longer body indicates more intense buying or selling force or pressure.
Shorter body indicates little price movement and represent consolidation
Shorter body indicates little price movement and represent consolidation

Long hollow (white) candlestick indicates:-
- Intense buying pressure.
- The longer the white candlestick, the higher level is the close above the open. In other words, prices went up appreciably from open prices and buyers are aggressive.
- Potential turning point or support level after an extended decline.
Long filled (black) candlestick indicates:-
- Intense selling pressure
- The longer the black candlestick, the lower level is the close below the open.
In other words, prices went down appreciably from open prices and sellers are aggressive.
- Potential turning point or resistance level after a long advance.
Introduction to Candlestick Chart
History
The Japanese started to use technical analysis to trade rice during the 17th century.
Guiding principles of this early version Technical Analysis share the same principles as US version initiated by Charles Dow during 1900. This includes:-
- The "what" (price action) is more important than the "why" (news, earnings, and so on).
- All known information is reflected in the price.
- Buyers and sellers move markets based on expectations and emotions (fear and greed).
- Markets fluctuate.
- The actual price may not reflect the underlying value.
According to another source believed to be Steve Nison, such charting of candle stick first appeared sometime after 1850. Candlestick development and charting was primarily the effort of rice trader named Homma in Japan. Over some period his initial idea were modified and refined, which results in the system candlestick that is used today.
Formation
Candlestick chart is created based on data set containing Open, High, Low and Close value for each time period.
“The body” of candlestick consist of either hollow or filled portion. Sometimes it is also referred to as “the real body”.
“Shadows” are the long thin lines above and below the body which stand for high/low range. This means high is represented by Top Upper Shadow and low is marked by Bottom of Lower Shadow.
Hollow candlestick means that the stock closes higher than its opening price. This is represented by bottom of the body as opening price and top of the body as closing price.
Filled candlestick means that the stock closes lower than its opening price. This is represented by top of the body and opening price and bottom of the body as closing price. Advantages of Candlestick Charts:-
i) Easier to interpret and more visually appealing compared to traditional bar chart
ii) Provide clear picture of the price action, which allow trader to correlate between high and low as well as open and close. This information is important to feature of candlestick chart.
iii) Hollow candlestick, where close is greater than open, signify buying pressure, while filled candlestick, where close is less then open signify selling pressure.
The Japanese started to use technical analysis to trade rice during the 17th century.
Guiding principles of this early version Technical Analysis share the same principles as US version initiated by Charles Dow during 1900. This includes:-
- The "what" (price action) is more important than the "why" (news, earnings, and so on).
- All known information is reflected in the price.
- Buyers and sellers move markets based on expectations and emotions (fear and greed).
- Markets fluctuate.
- The actual price may not reflect the underlying value.
According to another source believed to be Steve Nison, such charting of candle stick first appeared sometime after 1850. Candlestick development and charting was primarily the effort of rice trader named Homma in Japan. Over some period his initial idea were modified and refined, which results in the system candlestick that is used today.
Formation
Candlestick chart is created based on data set containing Open, High, Low and Close value for each time period.
“The body” of candlestick consist of either hollow or filled portion. Sometimes it is also referred to as “the real body”.
“Shadows” are the long thin lines above and below the body which stand for high/low range. This means high is represented by Top Upper Shadow and low is marked by Bottom of Lower Shadow.
Hollow candlestick means that the stock closes higher than its opening price. This is represented by bottom of the body as opening price and top of the body as closing price.
Filled candlestick means that the stock closes lower than its opening price. This is represented by top of the body and opening price and bottom of the body as closing price.
Advantages of Candlestick Charts:-i) Easier to interpret and more visually appealing compared to traditional bar chart
ii) Provide clear picture of the price action, which allow trader to correlate between high and low as well as open and close. This information is important to feature of candlestick chart.
iii) Hollow candlestick, where close is greater than open, signify buying pressure, while filled candlestick, where close is less then open signify selling pressure.
Subscribe to:
Posts (Atom)

