Showing posts with label Technical Analysis. Show all posts

Thursday, January 15, 2009

Candlestick chart: Doji Introduction

Doji is formed by Open and Close trading price virtually equal.
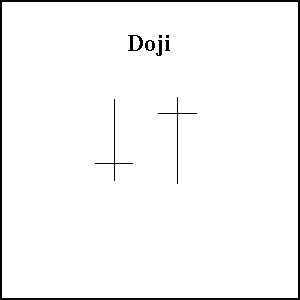
Upper and lower shadows length can be differ depending the buying and selling activities. This will result in candlestick forming cross, inverted cross or plus sign. If interpreted as only Doji pattern, it carries neutral pattern. However, by looking at the preceding price action future confirmation, doji may carries bullish or bearish bias information.
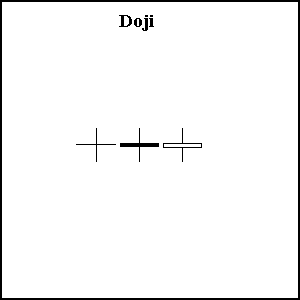
In ideal case, the open and close of trading should be equal. Doji suggest a sense of indecision between buyers and sellers. Presense of Upper and Lower shadow indicates price move above and below the opening level during trading session, but closes at or near opening level., resulting in standoff. This means that, neither buyer or seller were able to gain control, which means it could be a developing turning point.
Ideally, but not necessarily, the open and close should be equal. While a doji with an equal open and close would be considered more robust, it is more important to capture the essence of the candlestick. Doji convey a sense of indecision or tug-of-war between buyers and sellers. Prices move above and below the opening level during the session, but close at or near the opening level. The result is a standoff. Neither bulls nor bears were able to gain control and a turning point could be developing.

To determine robustness, it is suggested that comparison with previous candlestick body is necessary. A doji should have a small body that looks like a thin line in comparison to previous candlestick. A doji that forms among other candlesticks with small real bodies, would be considered insignificant. Conversely, a doji that forms among long real bodies candlesticks is considered significant.

Monday, January 12, 2009

Candlestick chart: Spinning Tops

Spinning Tops


Another type of candlestick chart, known as spinning top possess both long upper and long lower shadow. Spinning tops characteristics:-
- The short body shows small movement from open to close.
- Long shadows on the upper and lower side indicates buyer and seller were active during the trading session.
- The open and close maybe short (small), however, price move significantly higher and lower during the trading session.

Spinning tops indicates indecision trading. Neither party managed to dominate buying or selling actions, thus resulting in Standoff.

Indication:-
After Long Hollow (White) candlestick, a spinning top signify weakness among uptrend and a potential reverse or interruption in trend.
Conversely, after Long (Filled) candlestick, a spinning top signify weakness among downtrend and a potential reverse or interruption in trend.

Thursday, January 8, 2009

Candlestick chart: Short and Long Shadow

Short vs Long Bodies

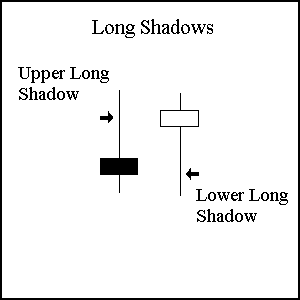
The shadow both on the upper and lower side of bodies indicates important information on the trading the session. Upper shadow shows session high while lower shadow indicates session low. Short shadow candlestick indicates that trading action is limited near to Open and Close. Long shadow candlestick means that trading action advance well past open and close. Long Upper Shadow and Short Lower Shadow :-
Buyer controlled the trading session, and bid prices higher. Later on, sellers forced the price down and this is followed by a weak close, thus forming long upper shadow.

Long Lower shadow and Short Upper shadow:-
Seller controlled the trading session, and push the price lower. Later on, buyer force the price up and this is followed by strong close, thus forming long lower shadow.

Wednesday, January 7, 2009

Candlestick chart: Marubozu


Diagram above indicates both black and white bodies without upper and lower shadow. This is known as Marubozu, and its characteristics:-

- The high and low are represented by open and close, in this case.
- White Marubozu, is represented by Open equals to Low and Close equals to High. This means that buyer control the price action from the start of trading to the last trade.
- Black Marubozu, is represented by Open equals to High and Close equals to Low. This means the seller control the price action from start of trading to the last trade.

Tuesday, January 6, 2009

Candlestick chart: Short and Long Bodies

Longer body indicates more intense buying or selling force or pressure.
Shorter body indicates little price movement and represent consolidation


Long hollow (white) candlestick indicates:-
- Intense buying pressure.
- The longer the white candlestick, the higher level is the close above the open. In other words, prices went up appreciably from open prices and buyers are aggressive.
- Potential turning point or support level after an extended decline.


Long filled (black) candlestick indicates:-
- Intense selling pressure
- The longer the black candlestick, the lower level is the close below the open.
In other words, prices went down appreciably from open prices and sellers are aggressive.
- Potential turning point or resistance level after a long advance.

Introduction to Candlestick Chart

History

The Japanese started to use technical analysis to trade rice during the 17th century.
Guiding principles of this early version Technical Analysis share the same principles as US version initiated by Charles Dow during 1900. This includes:-
- The "what" (price action) is more important than the "why" (news, earnings, and so on).
- All known information is reflected in the price.
- Buyers and sellers move markets based on expectations and emotions (fear and greed).
- Markets fluctuate.
- The actual price may not reflect the underlying value.
According to another source believed to be Steve Nison, such charting of candle stick first appeared sometime after 1850. Candlestick development and charting was primarily the effort of rice trader named Homma in Japan. Over some period his initial idea were modified and refined, which results in the system candlestick that is used today.

Formation
Candlestick chart is created based on data set containing Open, High, Low and Close value for each time period.
“The body” of candlestick consist of either hollow or filled portion. Sometimes it is also referred to as “the real body”.
“Shadows” are the long thin lines above and below the body which stand for high/low range. This means high is represented by Top Upper Shadow and low is marked by Bottom of Lower Shadow.
Hollow candlestick means that the stock closes higher than its opening price. This is represented by bottom of the body as opening price and top of the body as closing price.
Filled candlestick means that the stock closes lower than its opening price. This is represented by top of the body and opening price and bottom of the body as closing price. Advantages of Candlestick Charts:-
i) Easier to interpret and more visually appealing compared to traditional bar chart
ii) Provide clear picture of the price action, which allow trader to correlate between high and low as well as open and close. This information is important to feature of candlestick chart.
iii) Hollow candlestick, where close is greater than open, signify buying pressure, while filled candlestick, where close is less then open signify selling pressure.